You can’t make decisions based on data if you can’t see it. So how do you set up a Matomo dashboard to show the data you’re collecting using the Clean Insights SDKs?
Prerequisites
There are three parts to this process.
- Get a Matomo+CIMP (Clean Insights Matomo Proxy) server set up and get a siteId we can use in our cleaninsights.json configuration file.
- Integrating the Clean Insights SDK into your app and sending some test data to the server.
- Configure the Matomo dashboard to show just the data you want to you and your collaborators.
This article assumes you’ve already got a Matomo+CIMP server and a siteId and that you’ve sent some test data to your server. If you don’t have a server set up yet, you can read more about automatically provisioning CIMP+Matomo or adding CIMP to an existing Matomo deployment or contact us to get a spot on the Guardian Project’s shared Matomo+CIMP server. If you still need to integrate the SDK into your app, you can read more about that here [TODO: add link].
Why do we use Matomo as a backend?
- Because we don’t want to reinvent the wheel.
- Matomo includes a powerful, full featured analytics server. It includes graphing, user management, time filtering and more.
- Because users can mix and match Clean Insights and Matomo SDKs for data gathering for different use cases.
- For example, you might choose to use Clean Insights to measure sensitive data within your e2ee application, but use Matomo to do “ordinary” web analytics on your marketing page. When you do this, you can use the same analytics server to analyze both data streams.
- When mixing and matching, we recommend using separate siteIds for Matomo- and Clean Insights-sourced data. While this will result in looking at two different pages to see the different data, you’ll be able to take advantage of your Matomo SDK-sourced data’s depth (e.g. looking at unique visitors).
Why configure it specially and not just use the Matomo server as-is?
Matomo is built with its own SDKs in mind. If you or your collaborators less versed in the details of your implementation were to credulously read CI SDK-sourced data as it came in, you could be misled!
For example, Matomo is built to count unique visitors. When all the data Matomo sees is routed through the Clean Insights Matomo Proxy, it sees all data coming in via a single IP. Using that proxy to provide anonymity for users is the point. But other readers in our organization might see just a single or small # of unique visitors and not realize that data’s nonsensical. Best to show them everything that matters and nothing that doesn’t. This has the added benefit of preventing users from getting lost down a rabbit hole of “correct, but irrelevant” data that’s the hallmark of the “collect it all, analyze it later” surveillance capitalism model.
So how do I set up a Clean Insights Dashboard in Matomo?
Start by creating a new dashboard. Using Clean Insights, you can capture two different kinds of data, Events and Visits. Since most implementations look at Events, create a dashboard that just shows events.
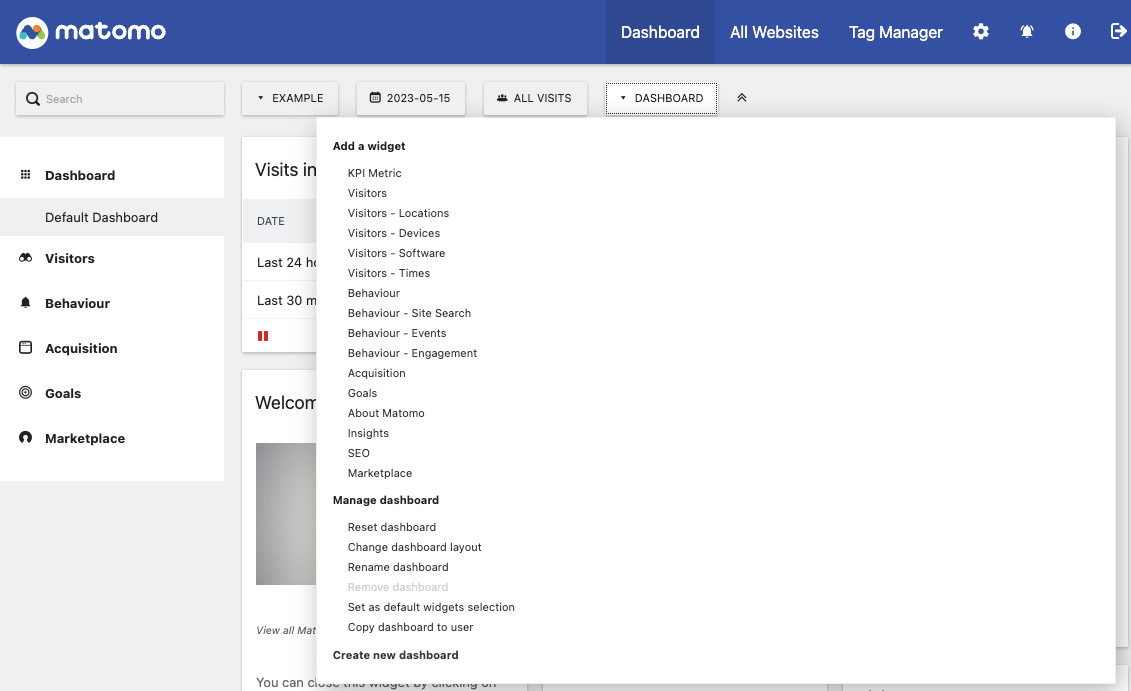
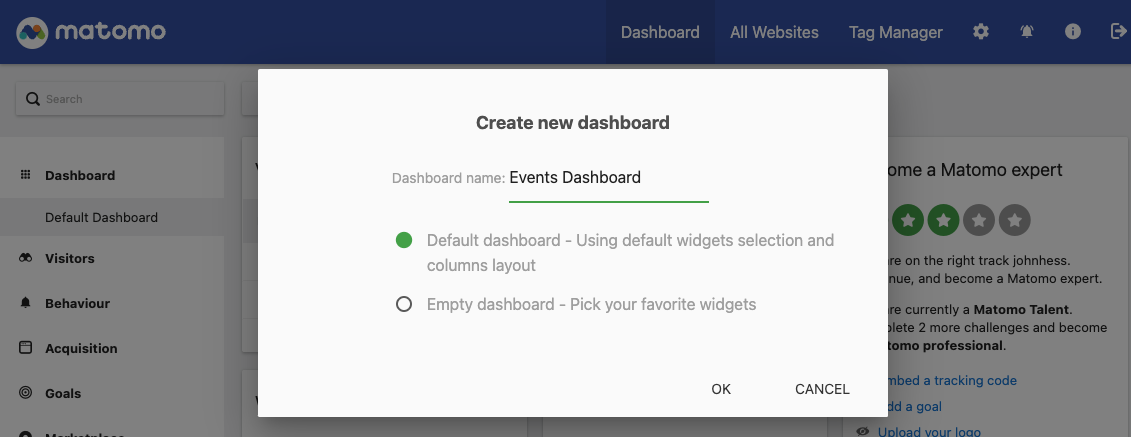
Name your new dashboard “Events Dashboard” and start from an empty dashboard.
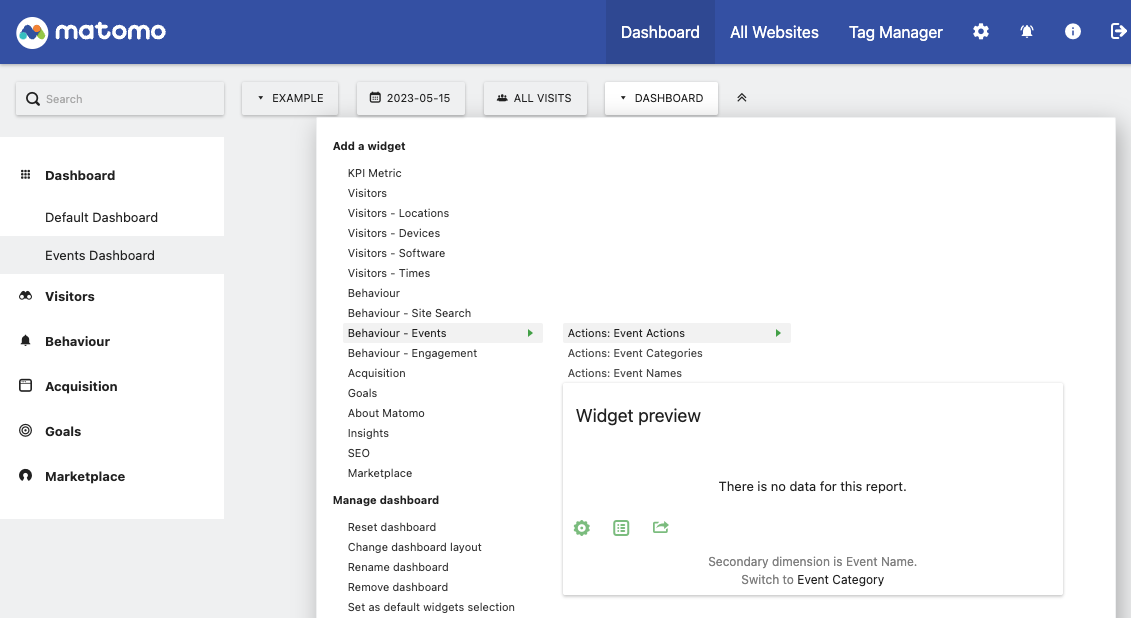
When prompted, click “Add A Widget”. From within “Behaviour - Events”, select “Actions: Event Categories”.
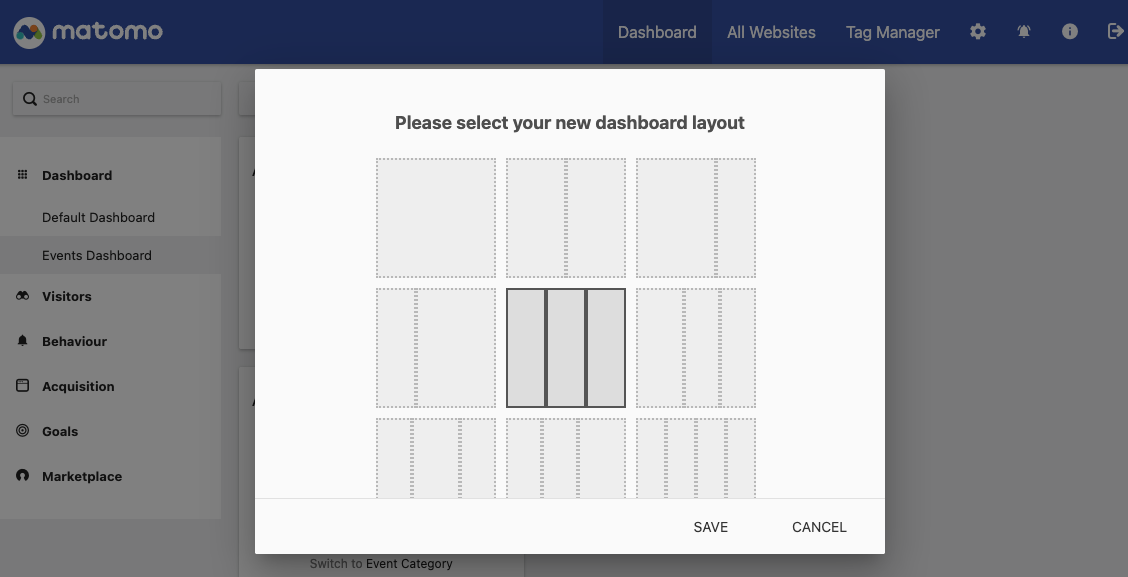
You’ll see your new widget stacked along the left side of the window. This tends to be a bit cramped, so change your dashboard layout to a single full-width column by selecting “Dashboard → Manage Dashboard → Change dashboard layout” and choosing the full-width option.
This is where you’ll be glad to have some test data. Depending on the type of events you’ve captured and how you’ve chosen to define the Category, Action, and Name for each, you might be really happy with this view which will show you the count of Events by category and let you drill down.
Or, you might also prefer a different view. Here’s the data from Circulo, one of Guardian Project’s apps. I’ve already selected “This month” so I can see a healthy set of our data.
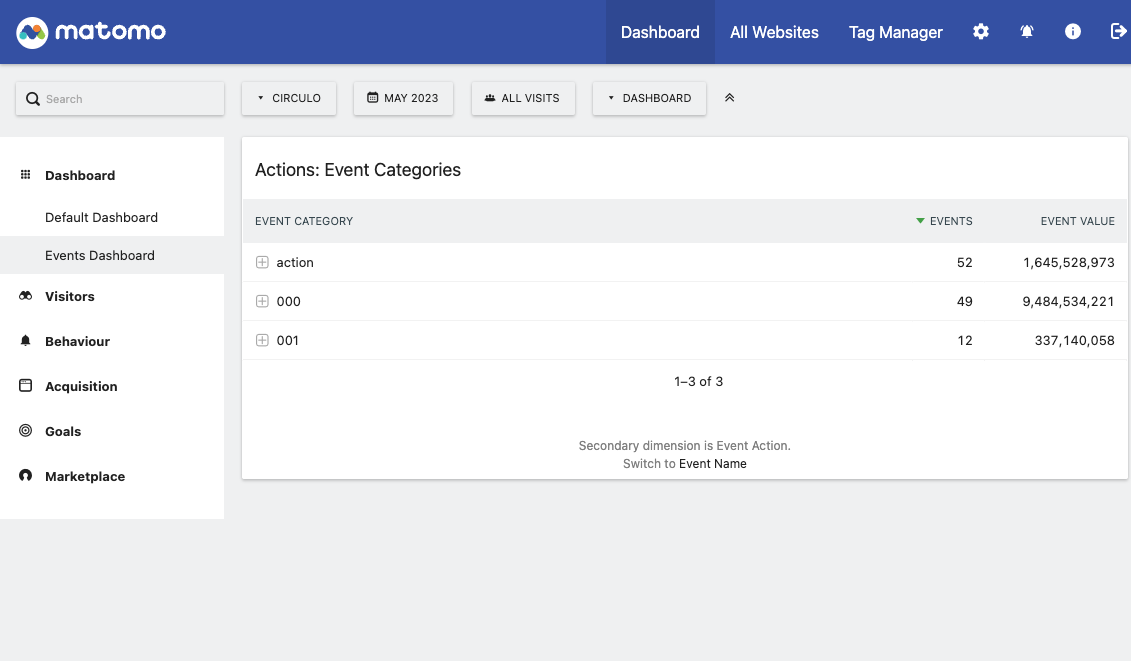
Well, this isn’t terribly informative. We’re seeing 3 categories, the vaguely named “action” and two numeric ones. What gives? Well, all of our events are usually in the bin “action”. And we’ve set up two focus groups who consented to being measured more particularly. Each of those categories contains the same set of activities (status-created, status-resolved, etc.).
I guess each time I filter to a date period I’m interested in, I could add up the values. But doing math is hard and time consuming. Instead, I want to see a view that shows the total # of times users engaged in those activities whether or not they were in a focus group. To do that, I can just add a new widget for “Actions: Event Action”. Ahh, that’s better:
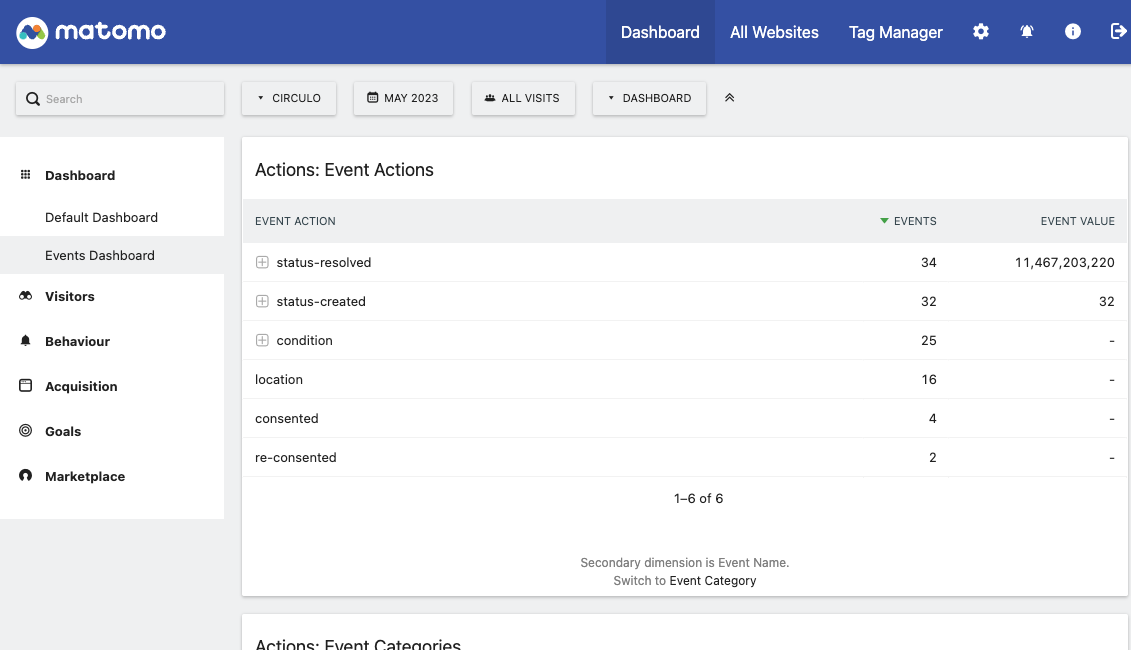
I can see that there were 32 status-created events and 34 status-resolved ones. You can’t resolve a status you didn’t create, but it’s possible those statuses were created before the month started or before the user consented to measurement.
Add the exact views that make sense for answering the questions you set out to. We recommend using only:
- Behavior - Events
- Actions: Event Categories
- Actions: Event Actions
- Actions: Event Names
- Behavior
- Pages (if using
measureVisit()) - Page Titles (if using
measureVisit()orclean-insights-auto-tracker.js)
- Pages (if using
You can modify the settings of each table to your liking, for example, by adding a totals row, setting the # of rows shown by default, or by displaying the data as a graphic instead of a table.
Now, you’ve got a useful dashboard that contains all the data you’re collecting and none of the possibly misleading data like “Unique Visitors”.
Sharing your dashboard with others
Everyone loves a dashboard. So let’s look at how to share your new dashboard with others.
First, create an account for your collaborators following Matomo’s guide. Note that if you don’t have your server configured to send email or if you use the Guardian Project’s server, you’ll need to copy the invite link and send it directly to your collaborator.
Next, share your dashboard to each new collaborator by going to the Dashboard menu and selecting “Copy dashboard to user”. Helpfully, this will replace, rather than augment, the user’s default dashboard.
Last, when you let folks know they’ve got an account, make sure to communicate to them that the dashboard is the place to look and that data they find elsewhere in the sidebar could be misleading. When I feel like I’ve completed my dashboard, I usually say something like
The data in the “Events Dashboard” has everything we’re gathering. If you’re interested in seeing more, let me know, but please know that you won’t find any new accurate data by drilling into the left side navigation bar.
when I send folks an invite link.
A few gotchas to keep in mind
- Once you copy a dashboard to a user, you can’t update their dashboard. Changes will only affect yours. If you copy it to them again, they’ll see a second one with the same name. Consider versioning your dashboard by adding something like “v2” to the name if you are sending folks new versions.
- The same list of dashboards will show up regardless of which siteId you’re looking at. If your server only has Clean Insights data on it, you’re in great shape. But if you also collect Matomo SDK-sourced data on this site, you’ll probably need a second dashboard.
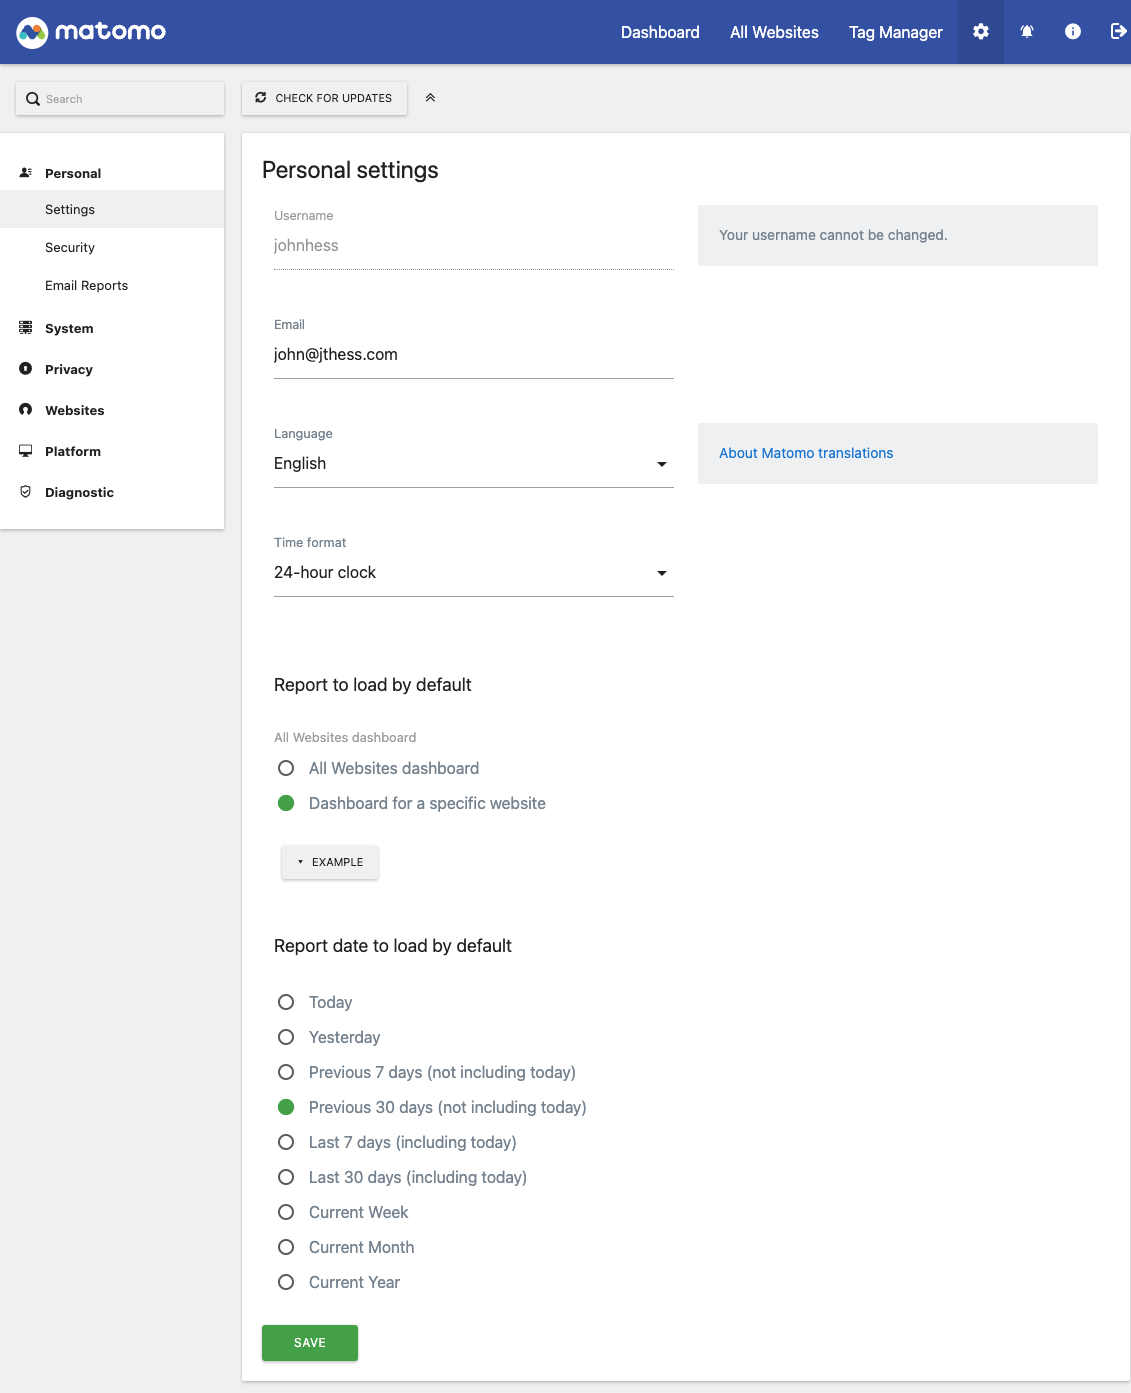
- By default, Matomo shows today’s data. Since Clean Insights’ SDKs aggregate data before sending it, this is virtually always empty. Users can either select a sensible date range every time they log in or use the Personal Settings menu to pick a default range that makes sense. Alas, admins can’t do this for their users.
Conclusion
By creating a custom dashboard to display data gathered with your Clean Insights SDK-sourced data and sharing it, you can empower your team with focused, trustworthy analytics data.